Overview
The Wuhan lockdown and the Henan floods were significant public crises that caused severe damage in recent years. These events highlighted the potential of pan-media as an innovative response mechanism for emergencies, integrating ordinary citizens into the traditionally government-led rescue system. By forming a “mutual aid ecosystem”, pan-media facilitates real-time feedback on rescue information and online rescue efforts alongside official on-site operations.
However, the spontaneous “mutual aid ecosystem” formed through social media has limitations, such as redundant data and difficulties in extracting valuable information.
This project aims to develop a data platform model that collects, processes, and visualizes public emergency information from social media, providing a structured prototype system for more effective crisis response.
Project Design Process
Henan Rainstorm Data Analysis
In order to study the phenomena we observed, verify the hypotheses we proposed, and design a suitable data platform model, we obtained the Weibo data from July 20, 2021 to July 22 2021 by calling the API, and extracted useful information, and analyzed the obtained data after cleaning.
The formation process of the “mutual aid ecosystem” on social media: In the entire ecosystem, we can see that in addition to help-seekers, different roles such as information release or- ganizers, information classification volunteers, and network res- cuers have also been formed, with corresponding functions and tasks. This division of labor plays a significant impact in mutual aid.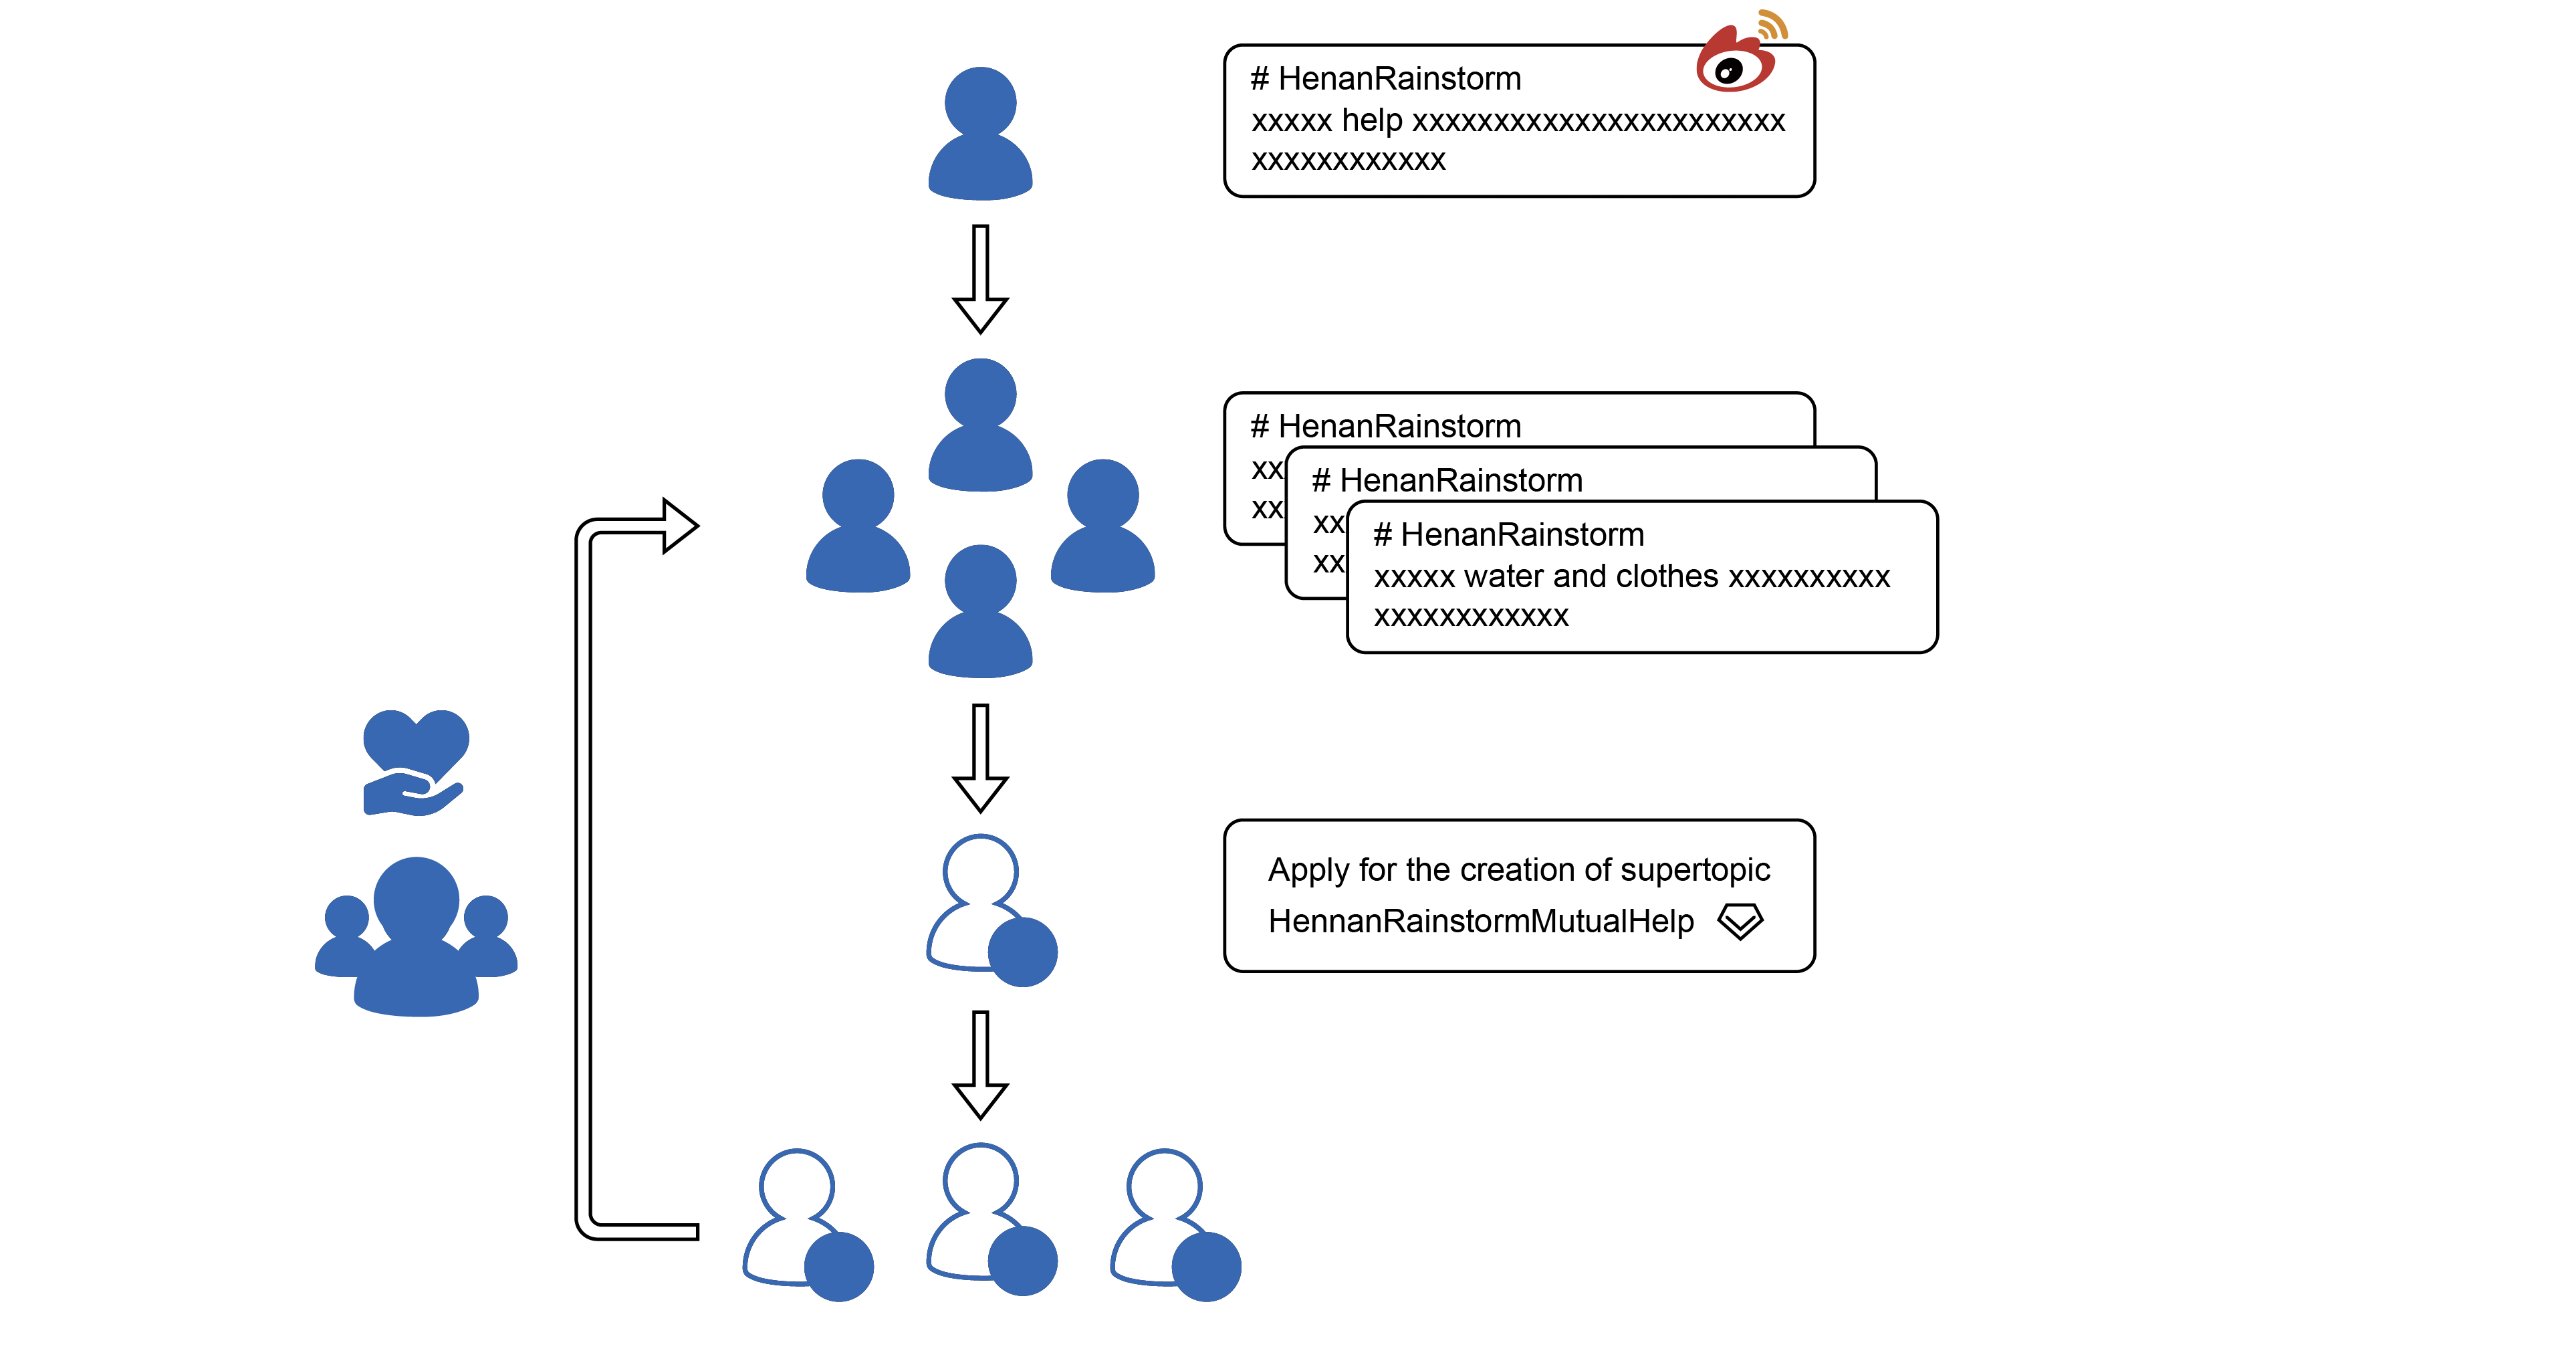
Posts forward distribution: The overall distribution showed a long-tail distribution which indicates the exist of Pareto principle. A small amount of informa- tion receives a large amount of exposure and it lead to the decrease the efficiency of the rescue and wastes a lot of time and human resources.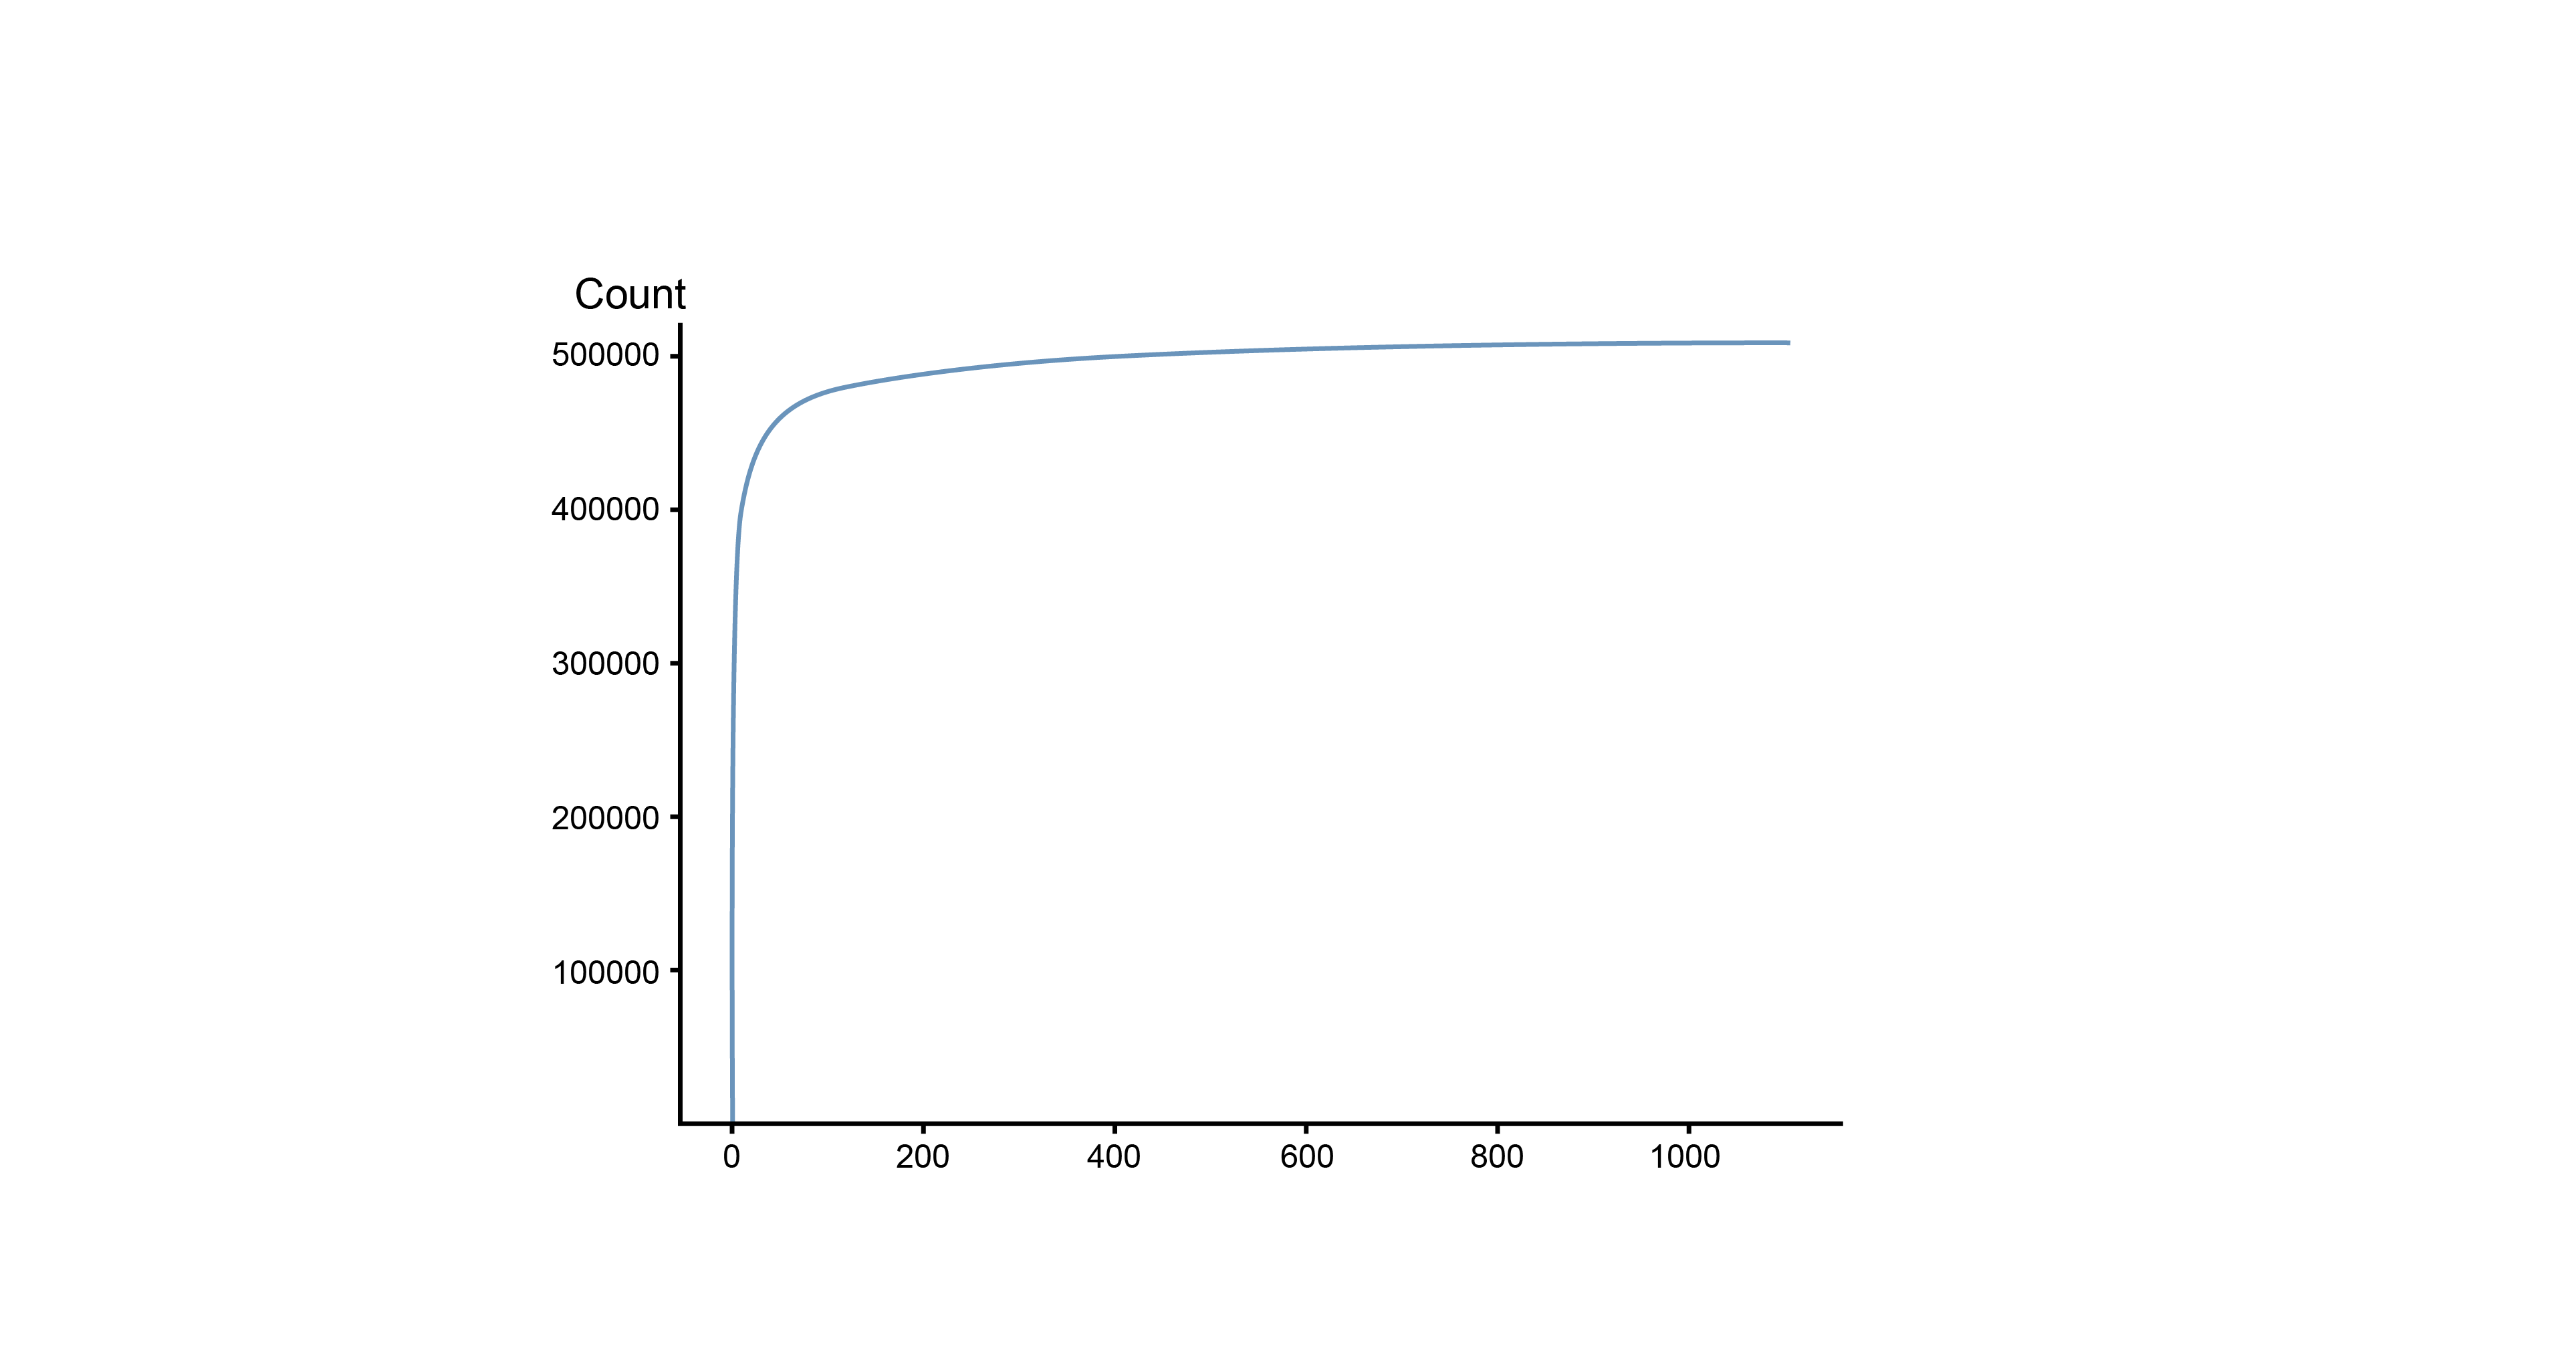
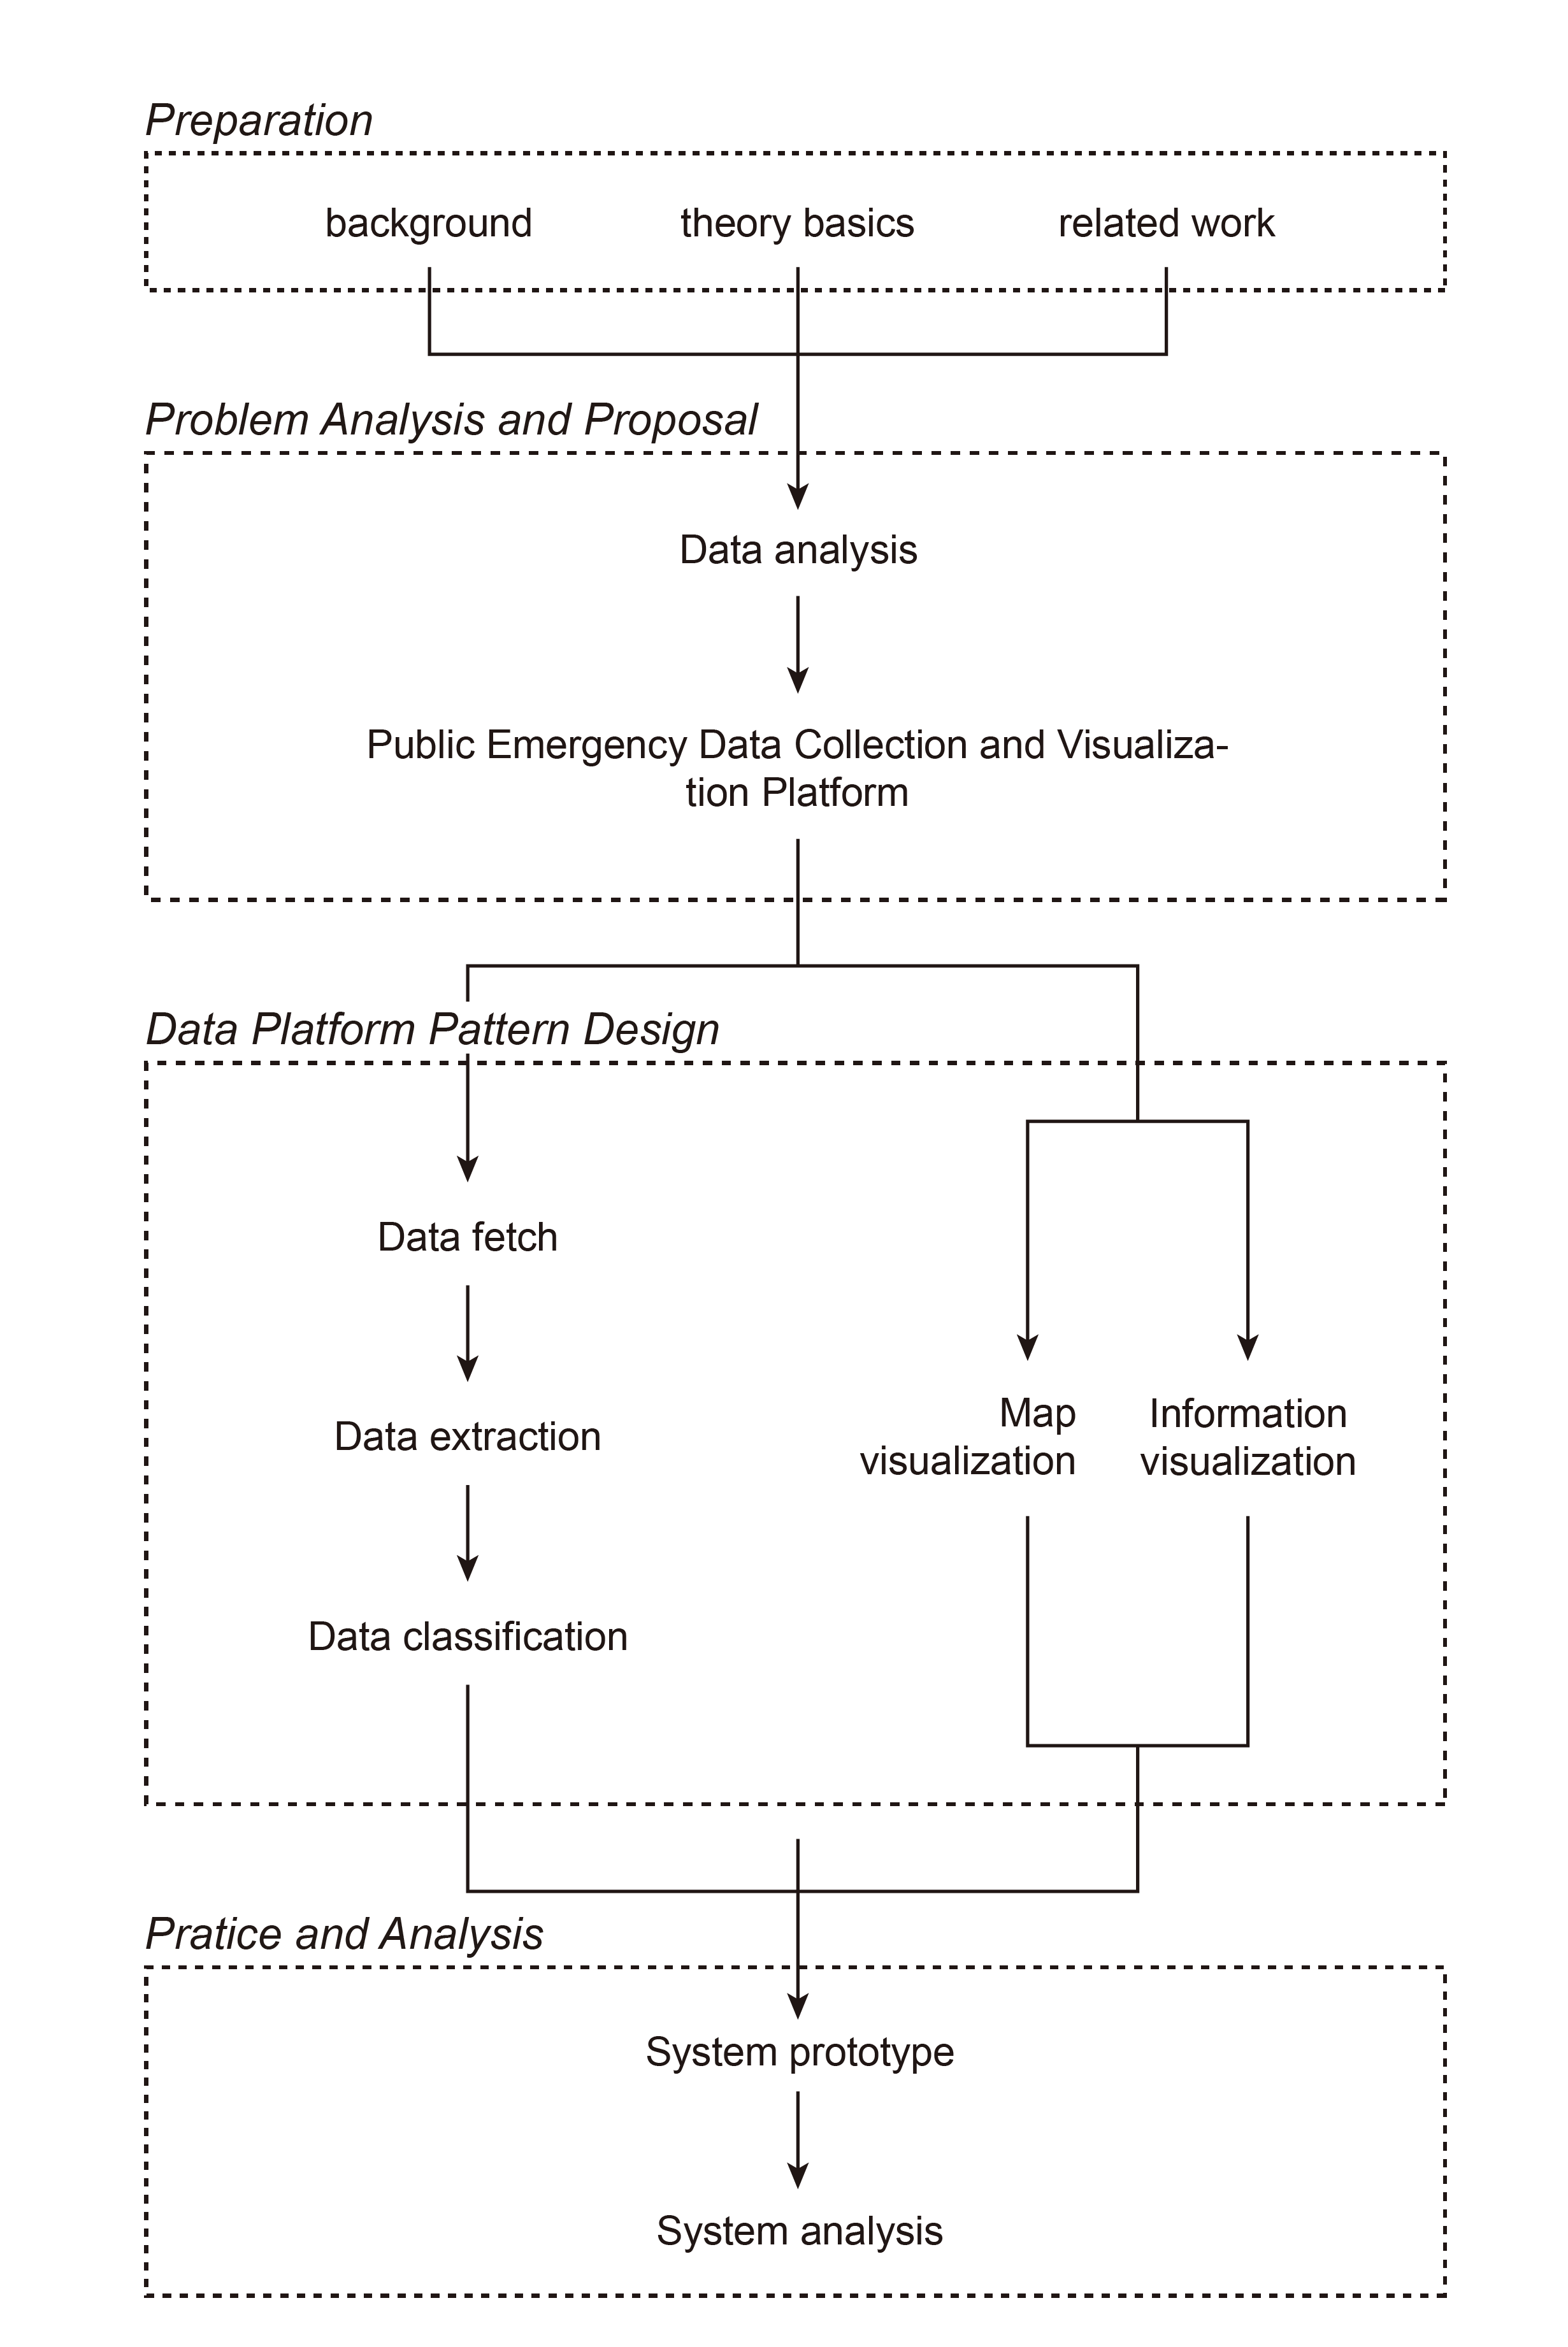
Data Processing System Design
Data Collection: In this project, the data mainly comes from social media platforms. In theory, to ensure the timeliness of information, we need to update data in real-time, but updating data in real-time consumes a large amount of computing resources and storage resources. Many platforms also limit the frequency of crawling data. Therefore, to balance data timeliness and platform overhead, we adopt a batch processing mode to perform batch calculations on data.
Data Extraction: This function is mainly used to clean, integrate and extract information from the original data. After cleaning, the data must be integrated and struc tured information extracted to facilitate subsequent.
Data Classifications: Data classification includes a text classifier, which is used to classify roughly extracted text information into three categories: help-seeking posts, help-providing posts, and others.
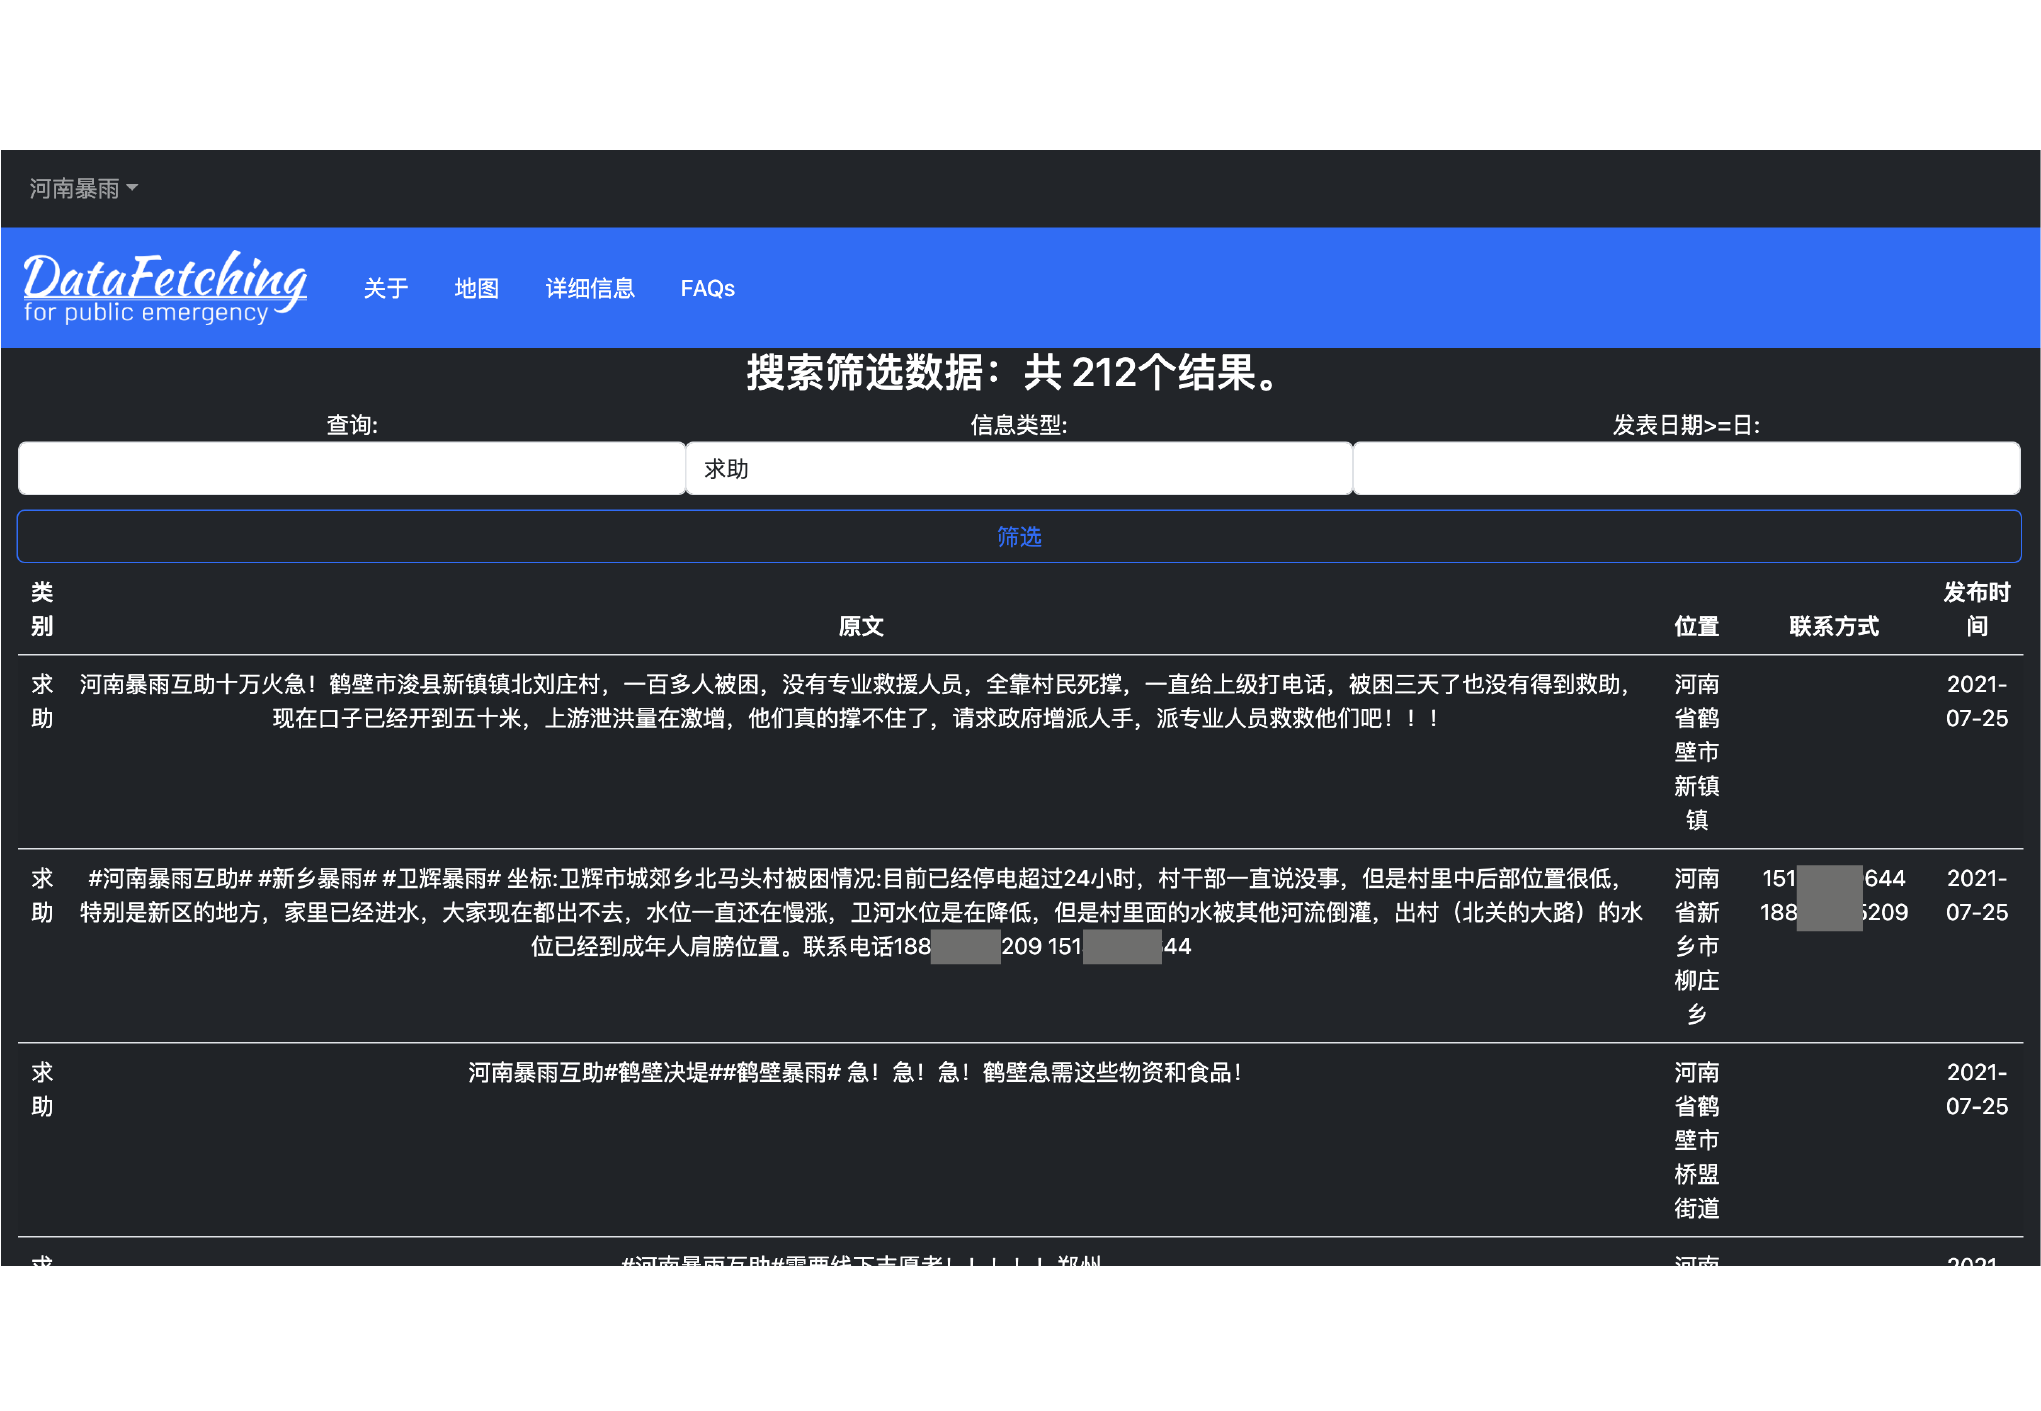
Data Visualization: This part visualizes the obtained data to present the data more intuitively and conveniently. In public emergencies, the most important informationnincludes geographical location information, contact information, and information content. Based on the above demands, we divide the visualization into geographical location and summary information. The former one is presented through a map, while latter is shown through a list and has filtering and retrieval functions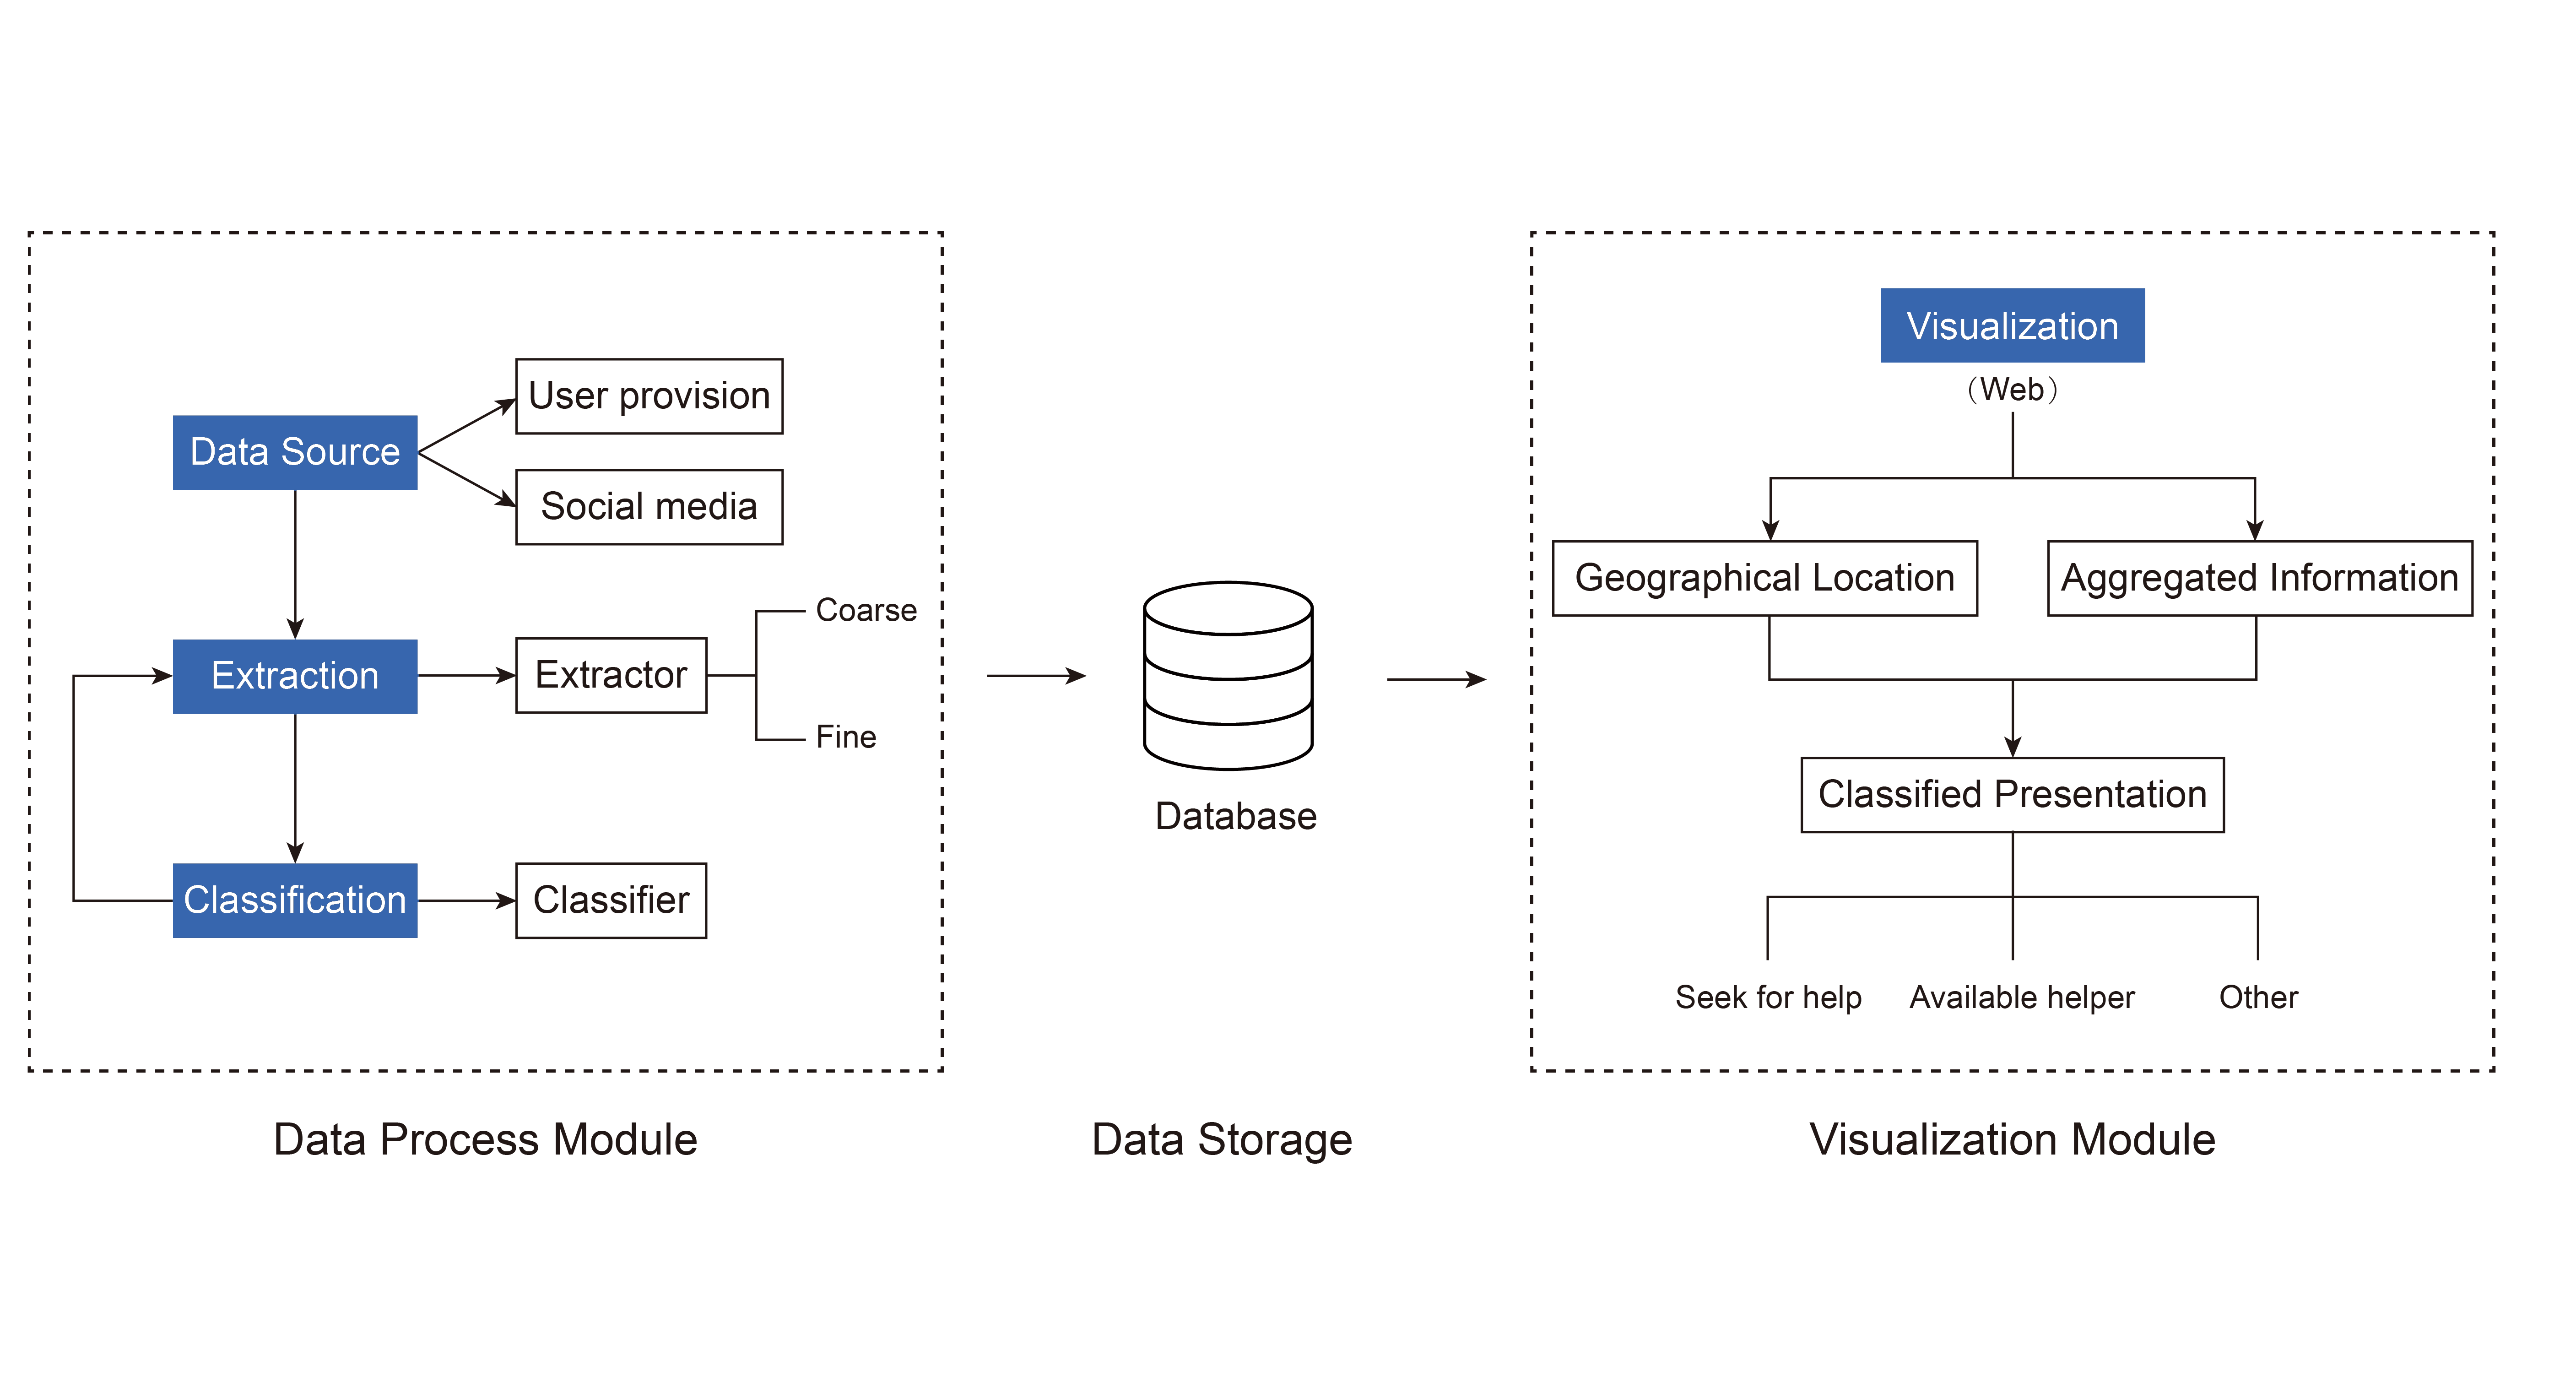
Demo