Overview
Humans created time as a shared abstraction, a collective agreement that allows society to function. The clock materializes this invisible consensus, making an intangible concept measurable and visible.
In this project, I explore a similar idea: What if knowledge and interpretation within an exhibition space could also become visible through consensus?
I designed an interactive system where visitors collectively construct a shared understanding of exhibits. The panel functions as a “clock”, not for time, but for accumulated perception.
System Design
The project consists of:
- A mobile application interface for visitor input
- A physical interactive panel (custom hardware) installed in the exhibition space
- A real-time aggregation system that translates individual responses into collective visualization
Visitors interact with the exhibit through the app, submitting interpretations, emotional reactions, or evaluations. These inputs are processed and dynamically reflected on the physical panel.
Over time, the panel becomes a living visualization of consensus showing an evolving index of collective perception.
“Clock” System Design
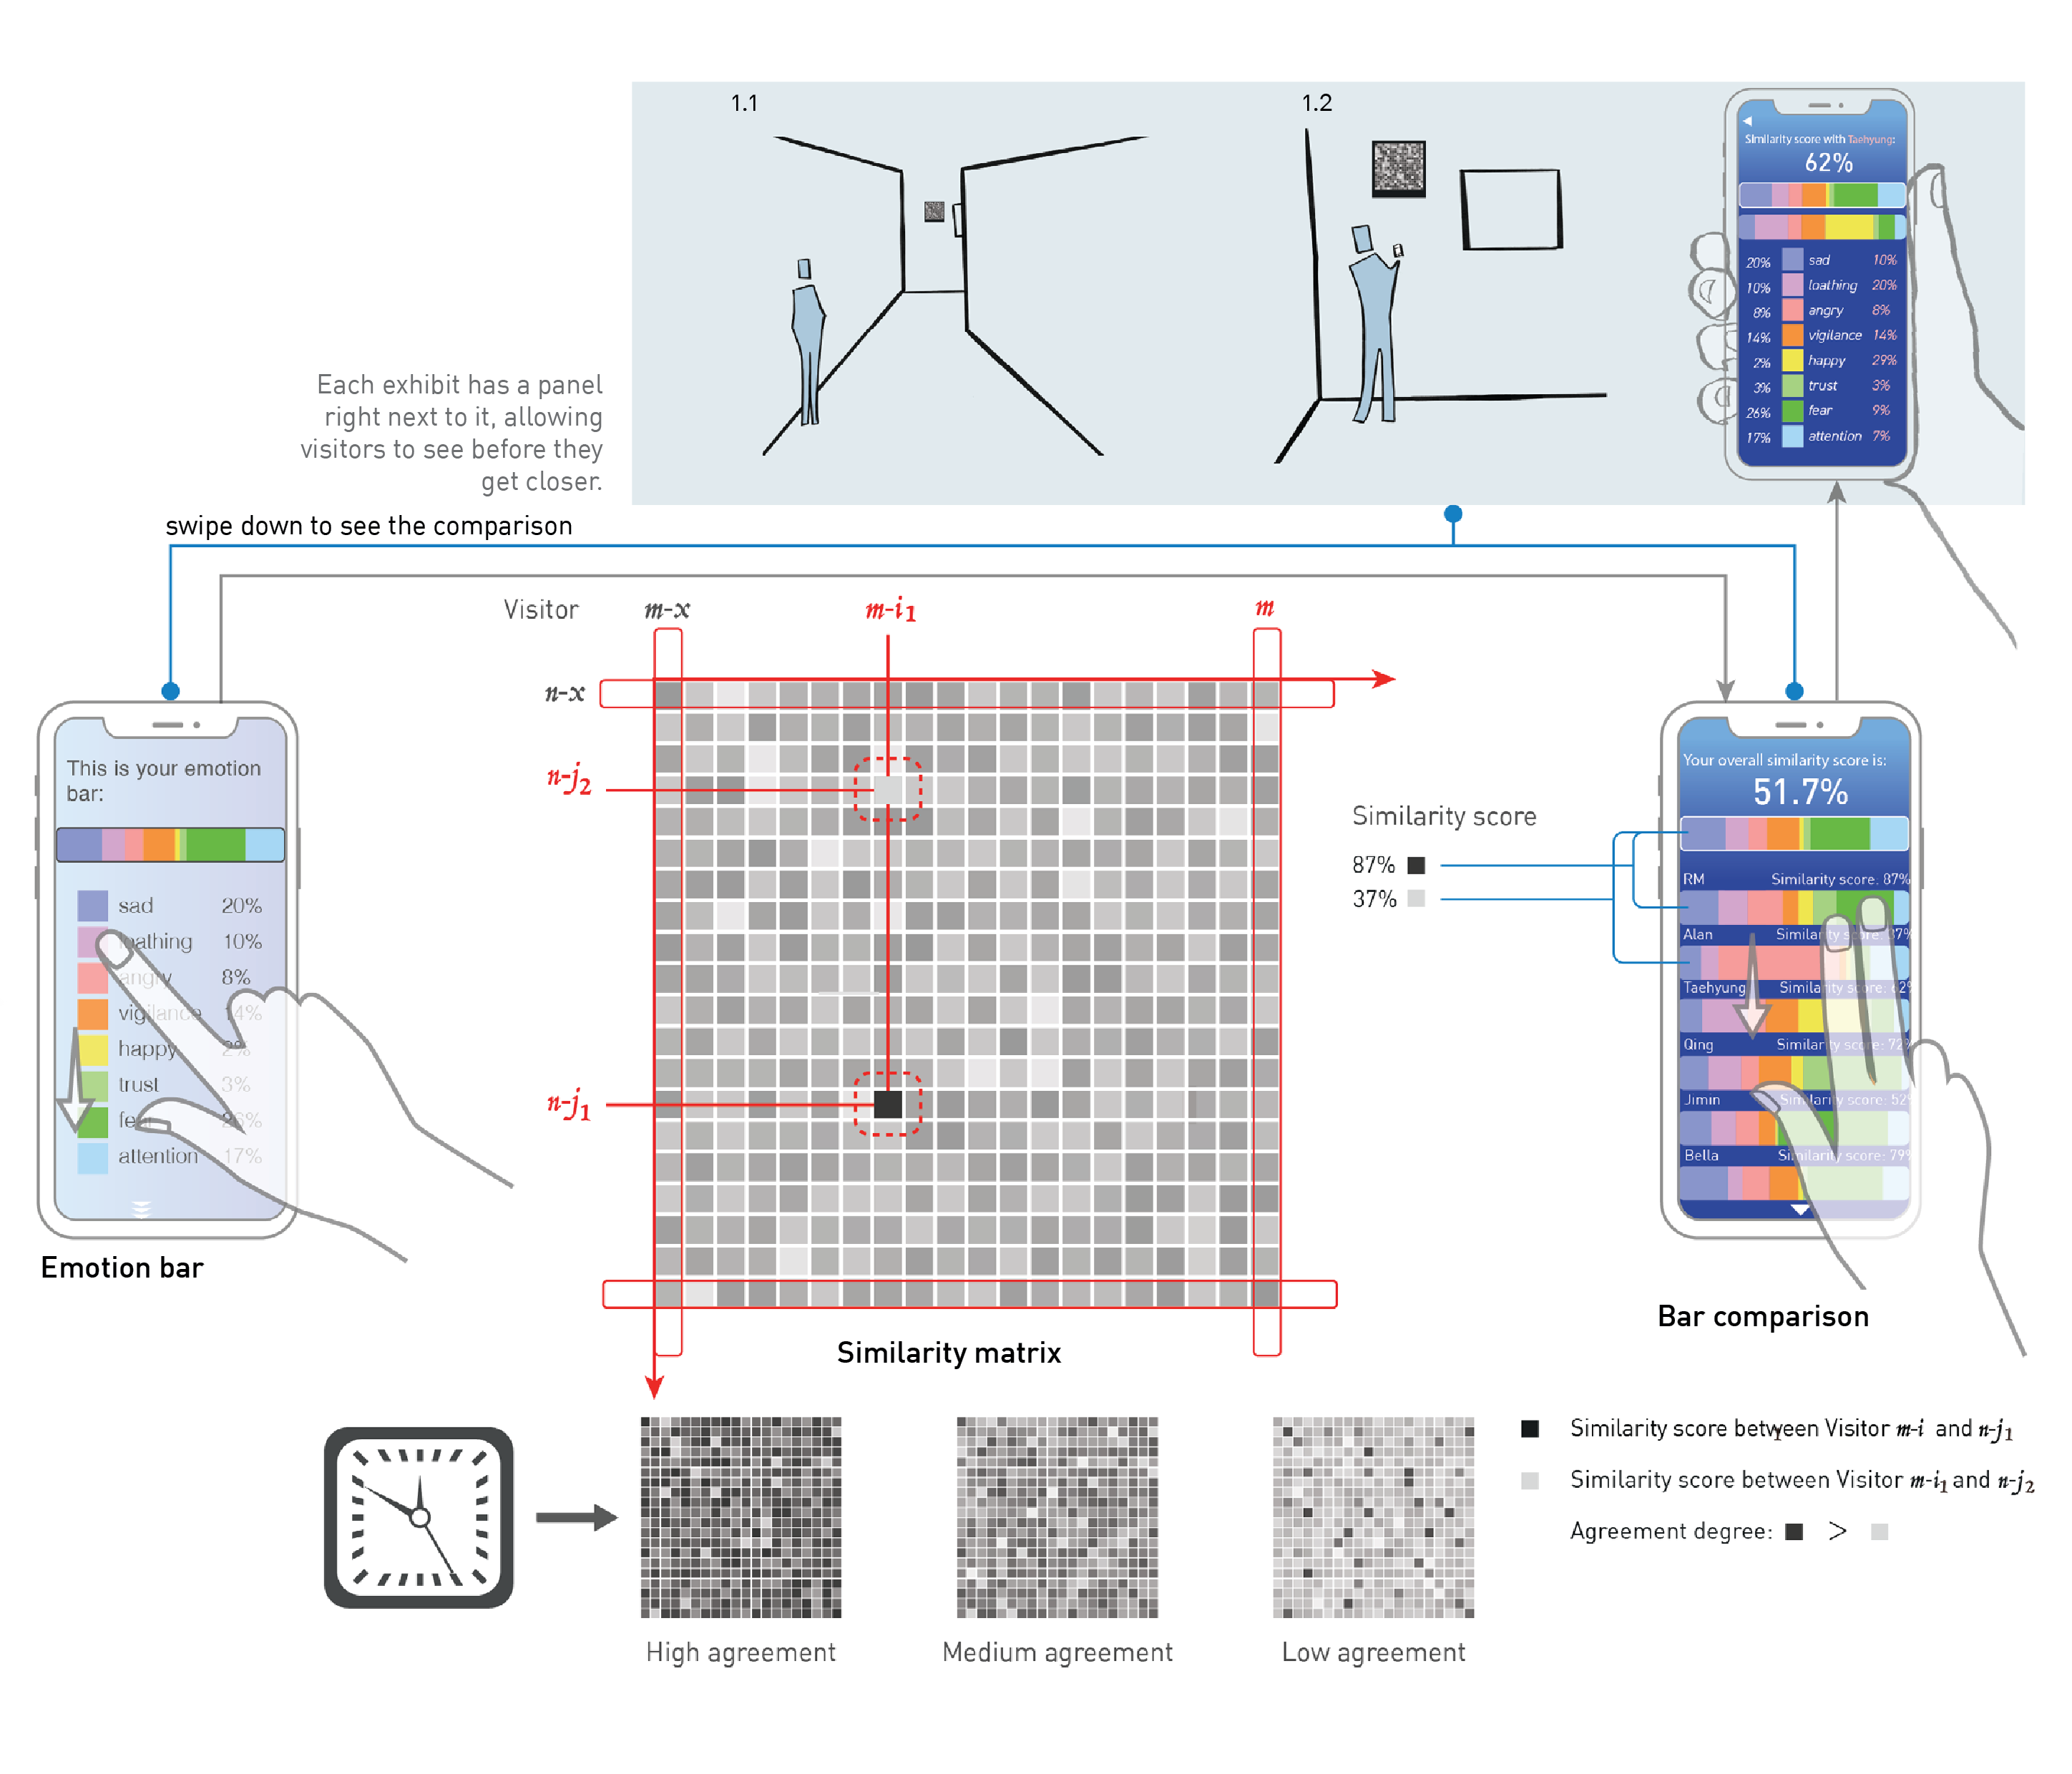
Emotion Clock
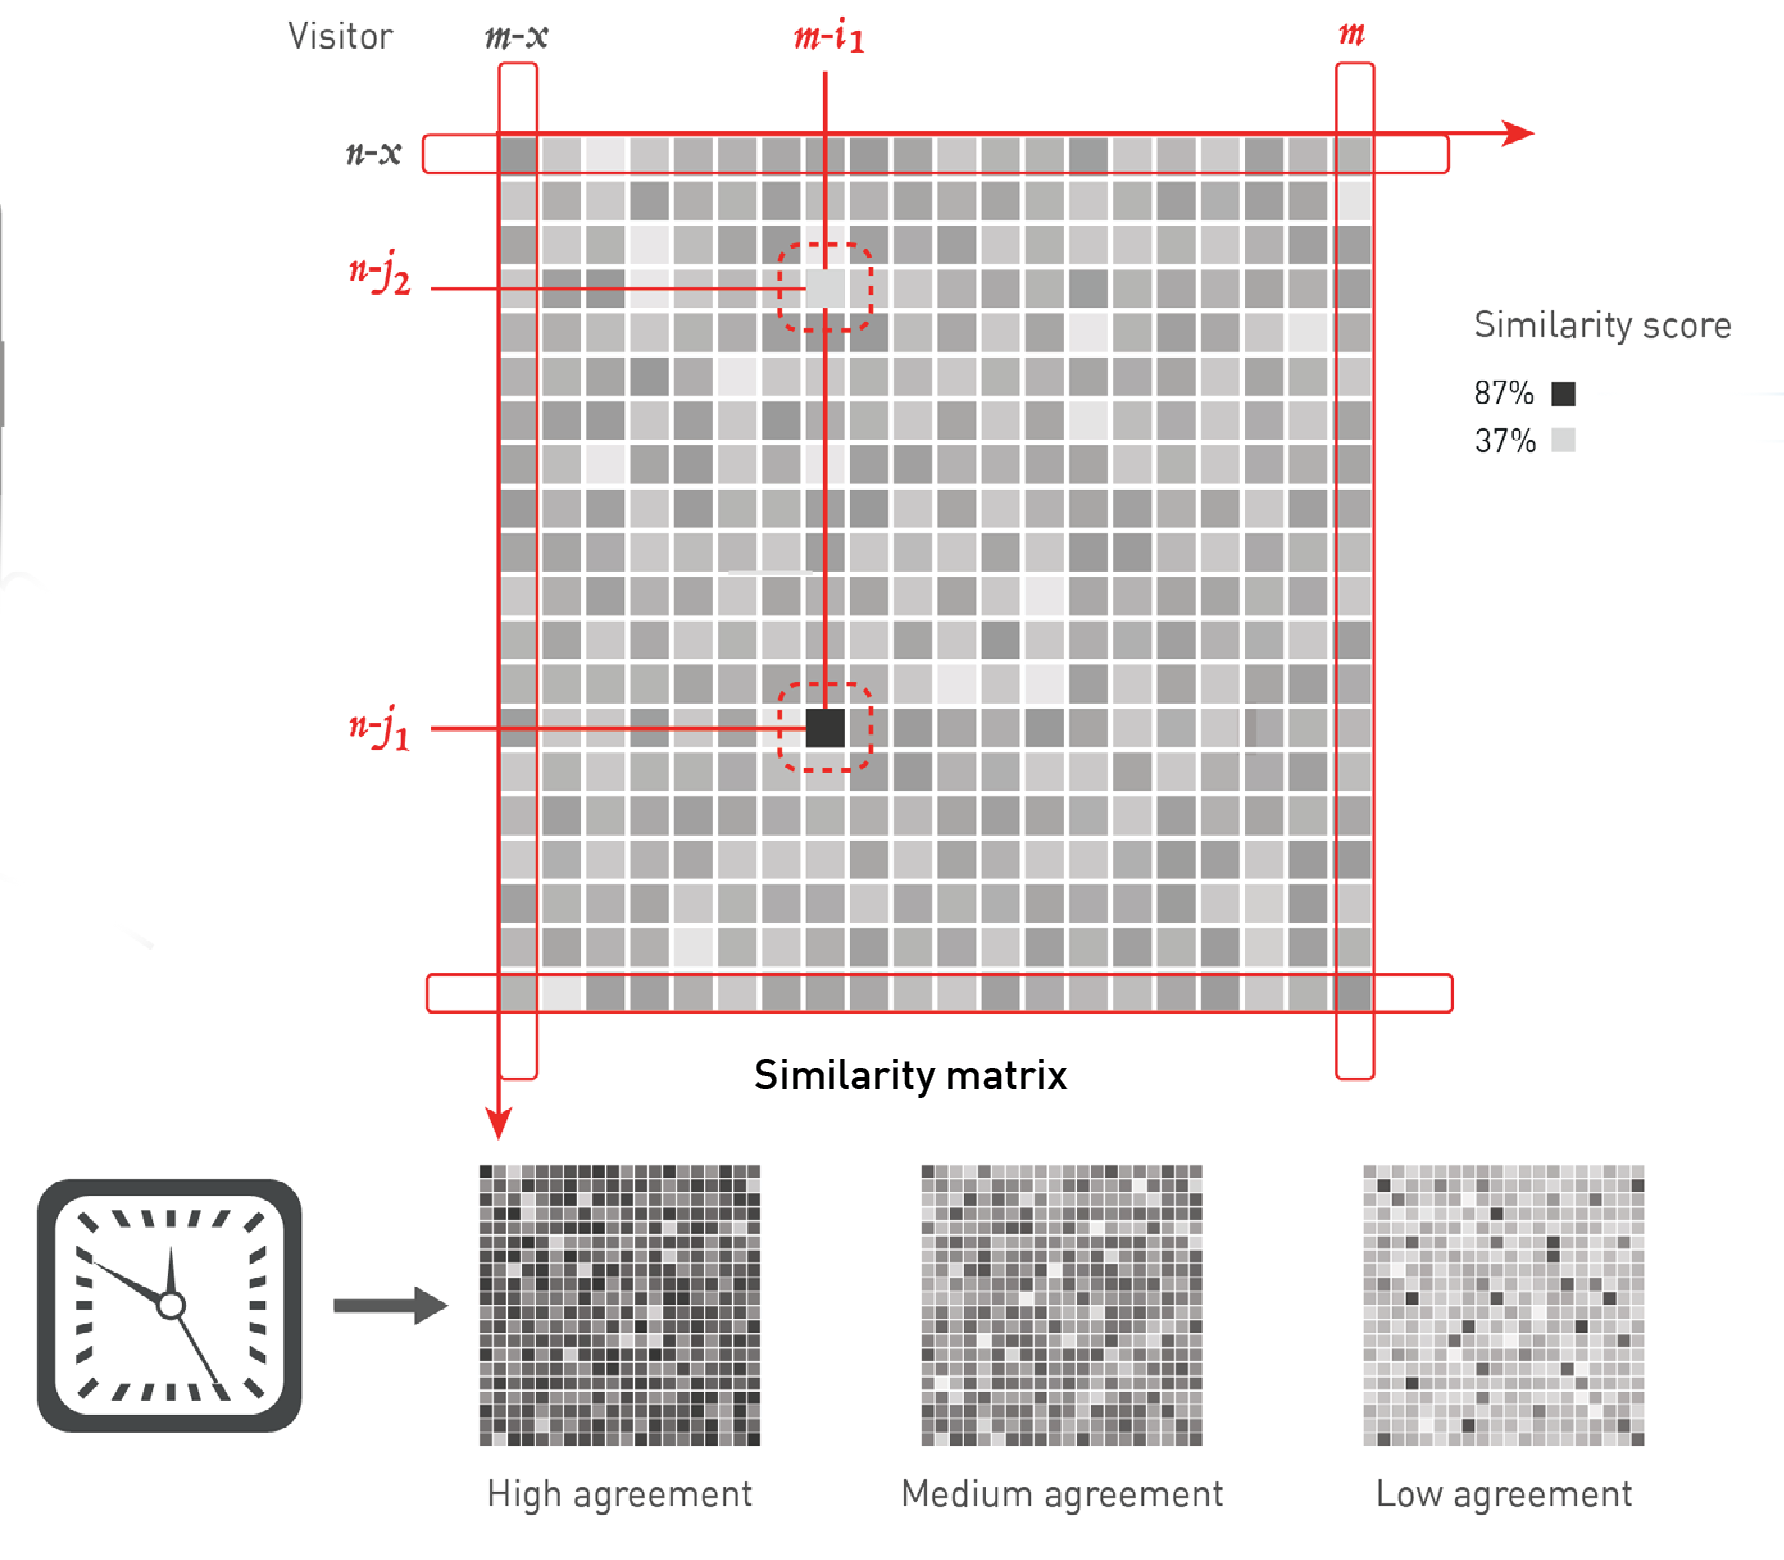
This is the visualization of a similarity matrix, which functioned as a clock to show visitors’ attitudes toward other exhibits. It involves the mutual similarity of $x$ interactive visitors. The latest interactive visitors are set to default and displayed to the visitor. Since the current interactive visitor is the latest visitor to interact with the panel, column $n$ and row $n$ show similarities between this visitor and former $x$ visitors.
Clock Installation
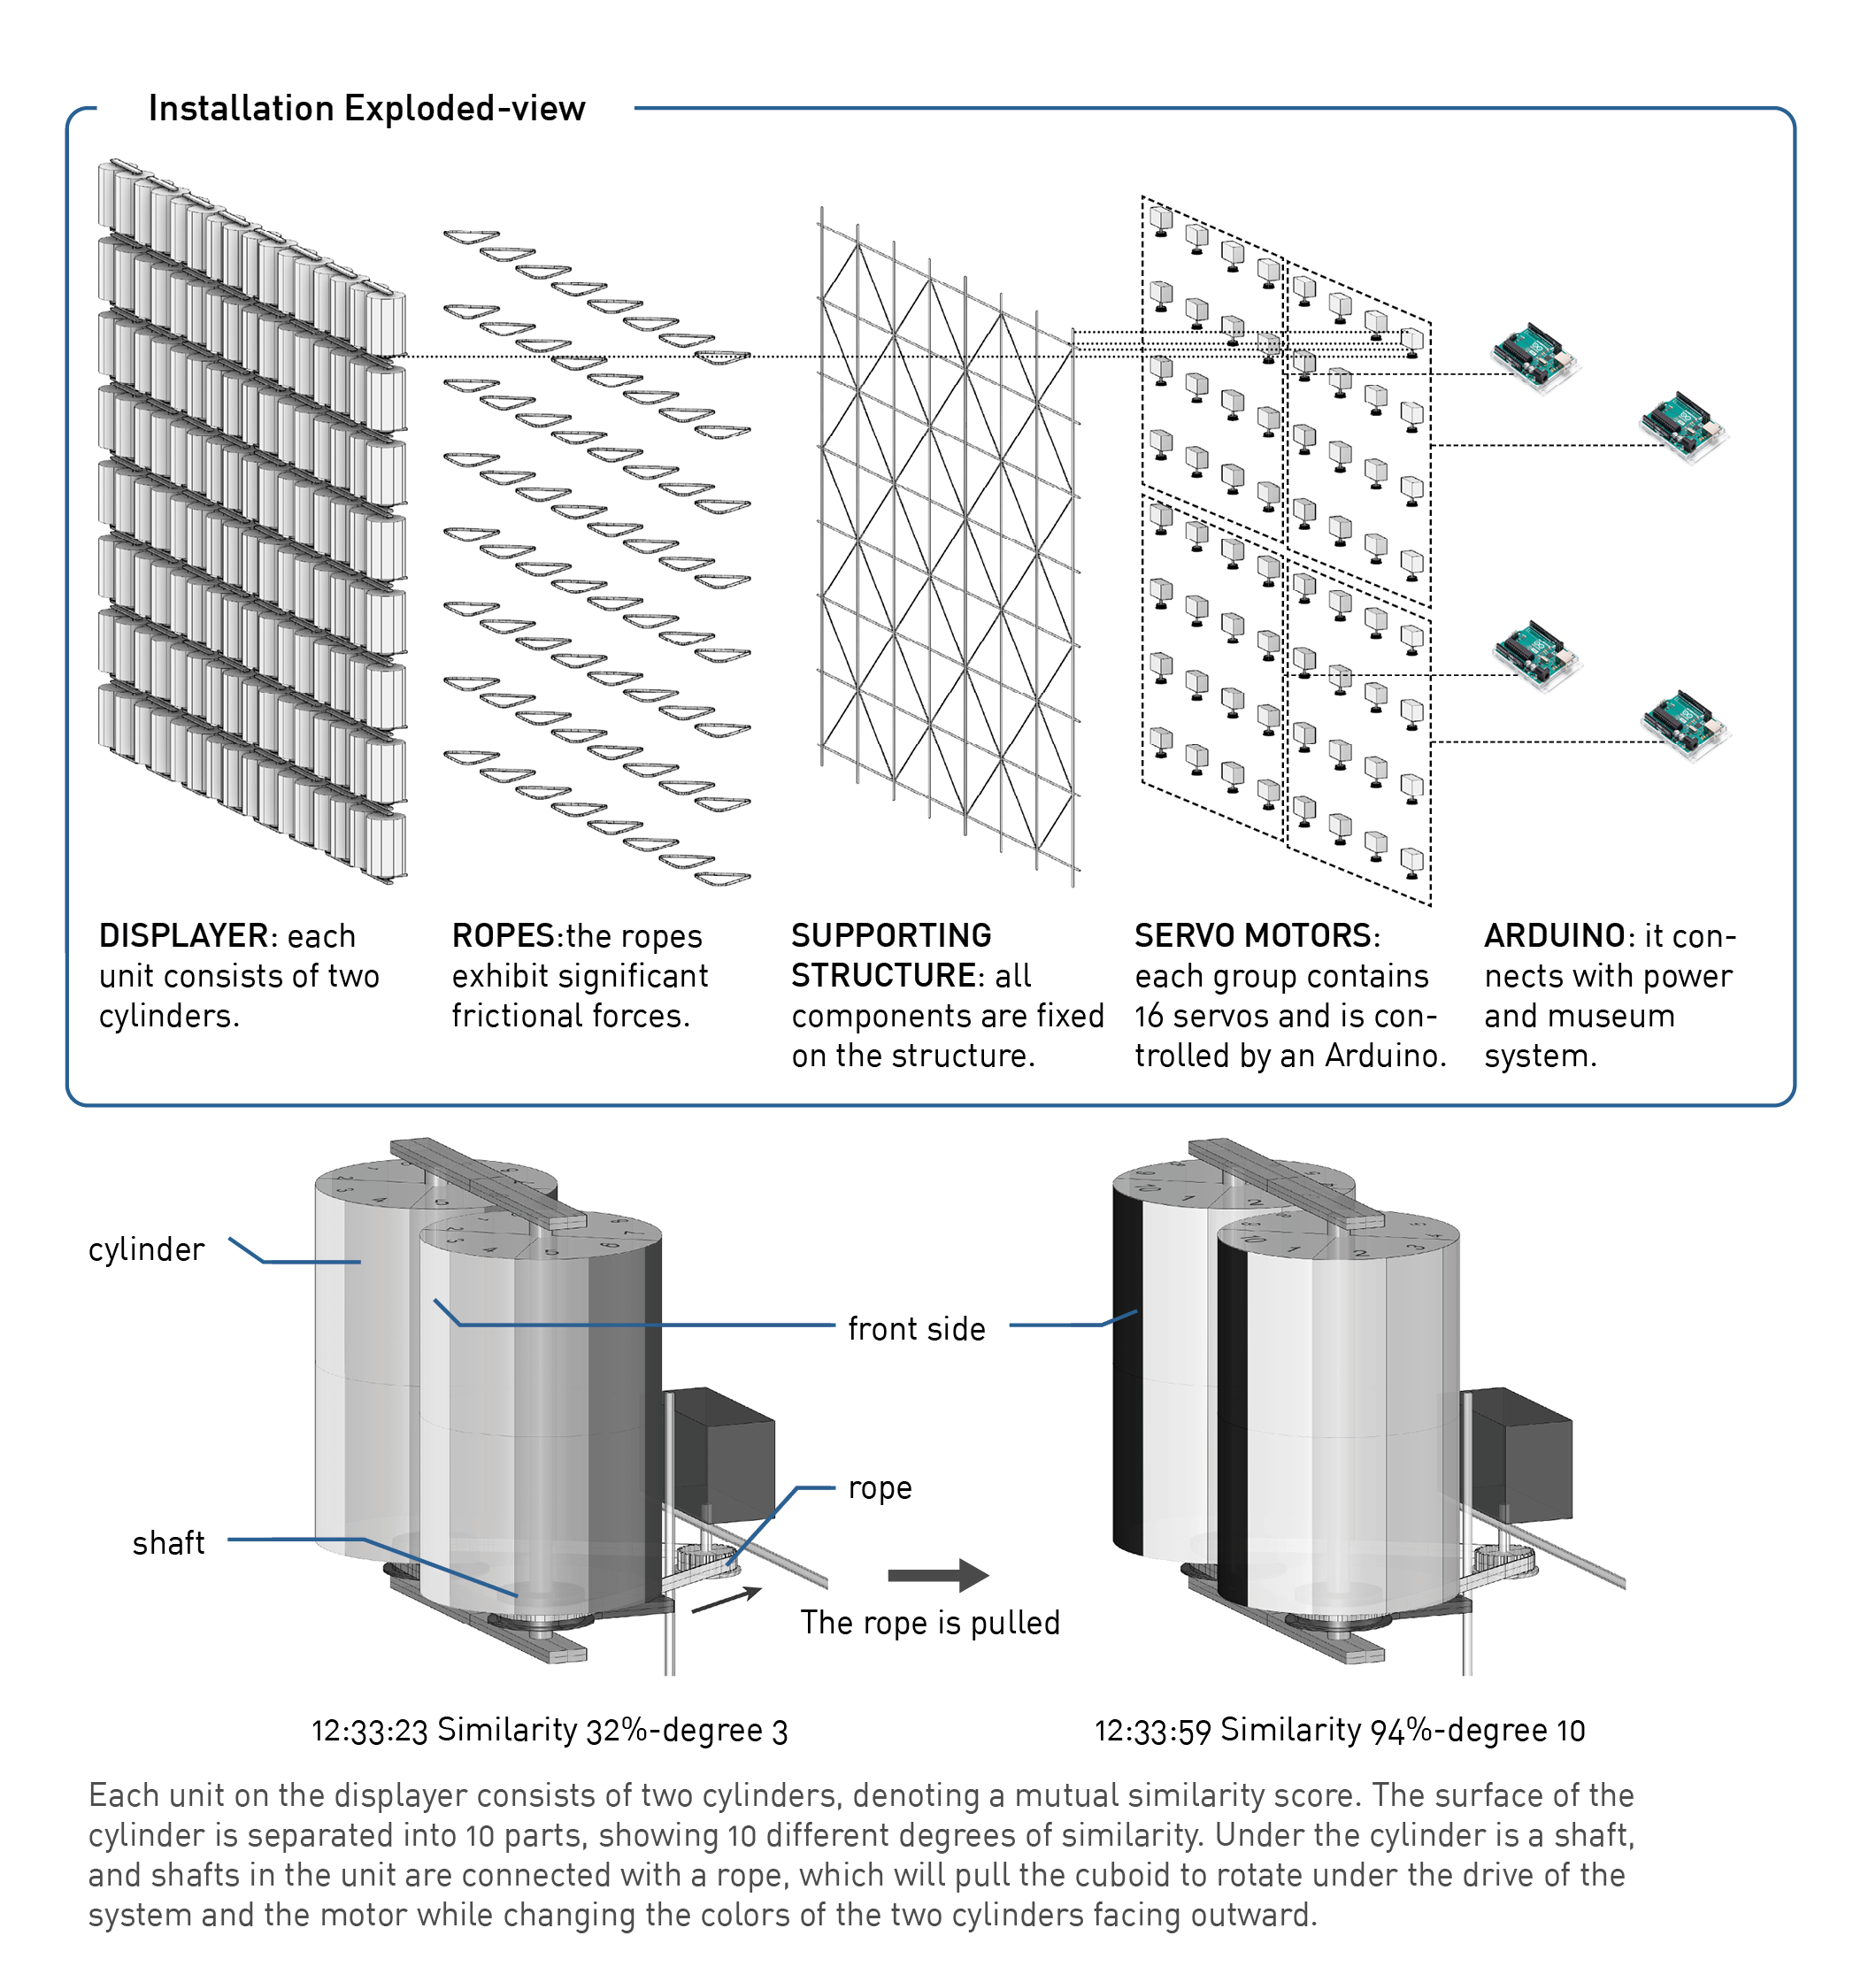
This panel installation is used to show the similarity matrix.
Data Workflow
This process depicts a detailed process related to data, from data collection to data computation. Expressly, the data storage and computation environment is set on the cloud. The data computation is based on Python, with different libraries in different tasks.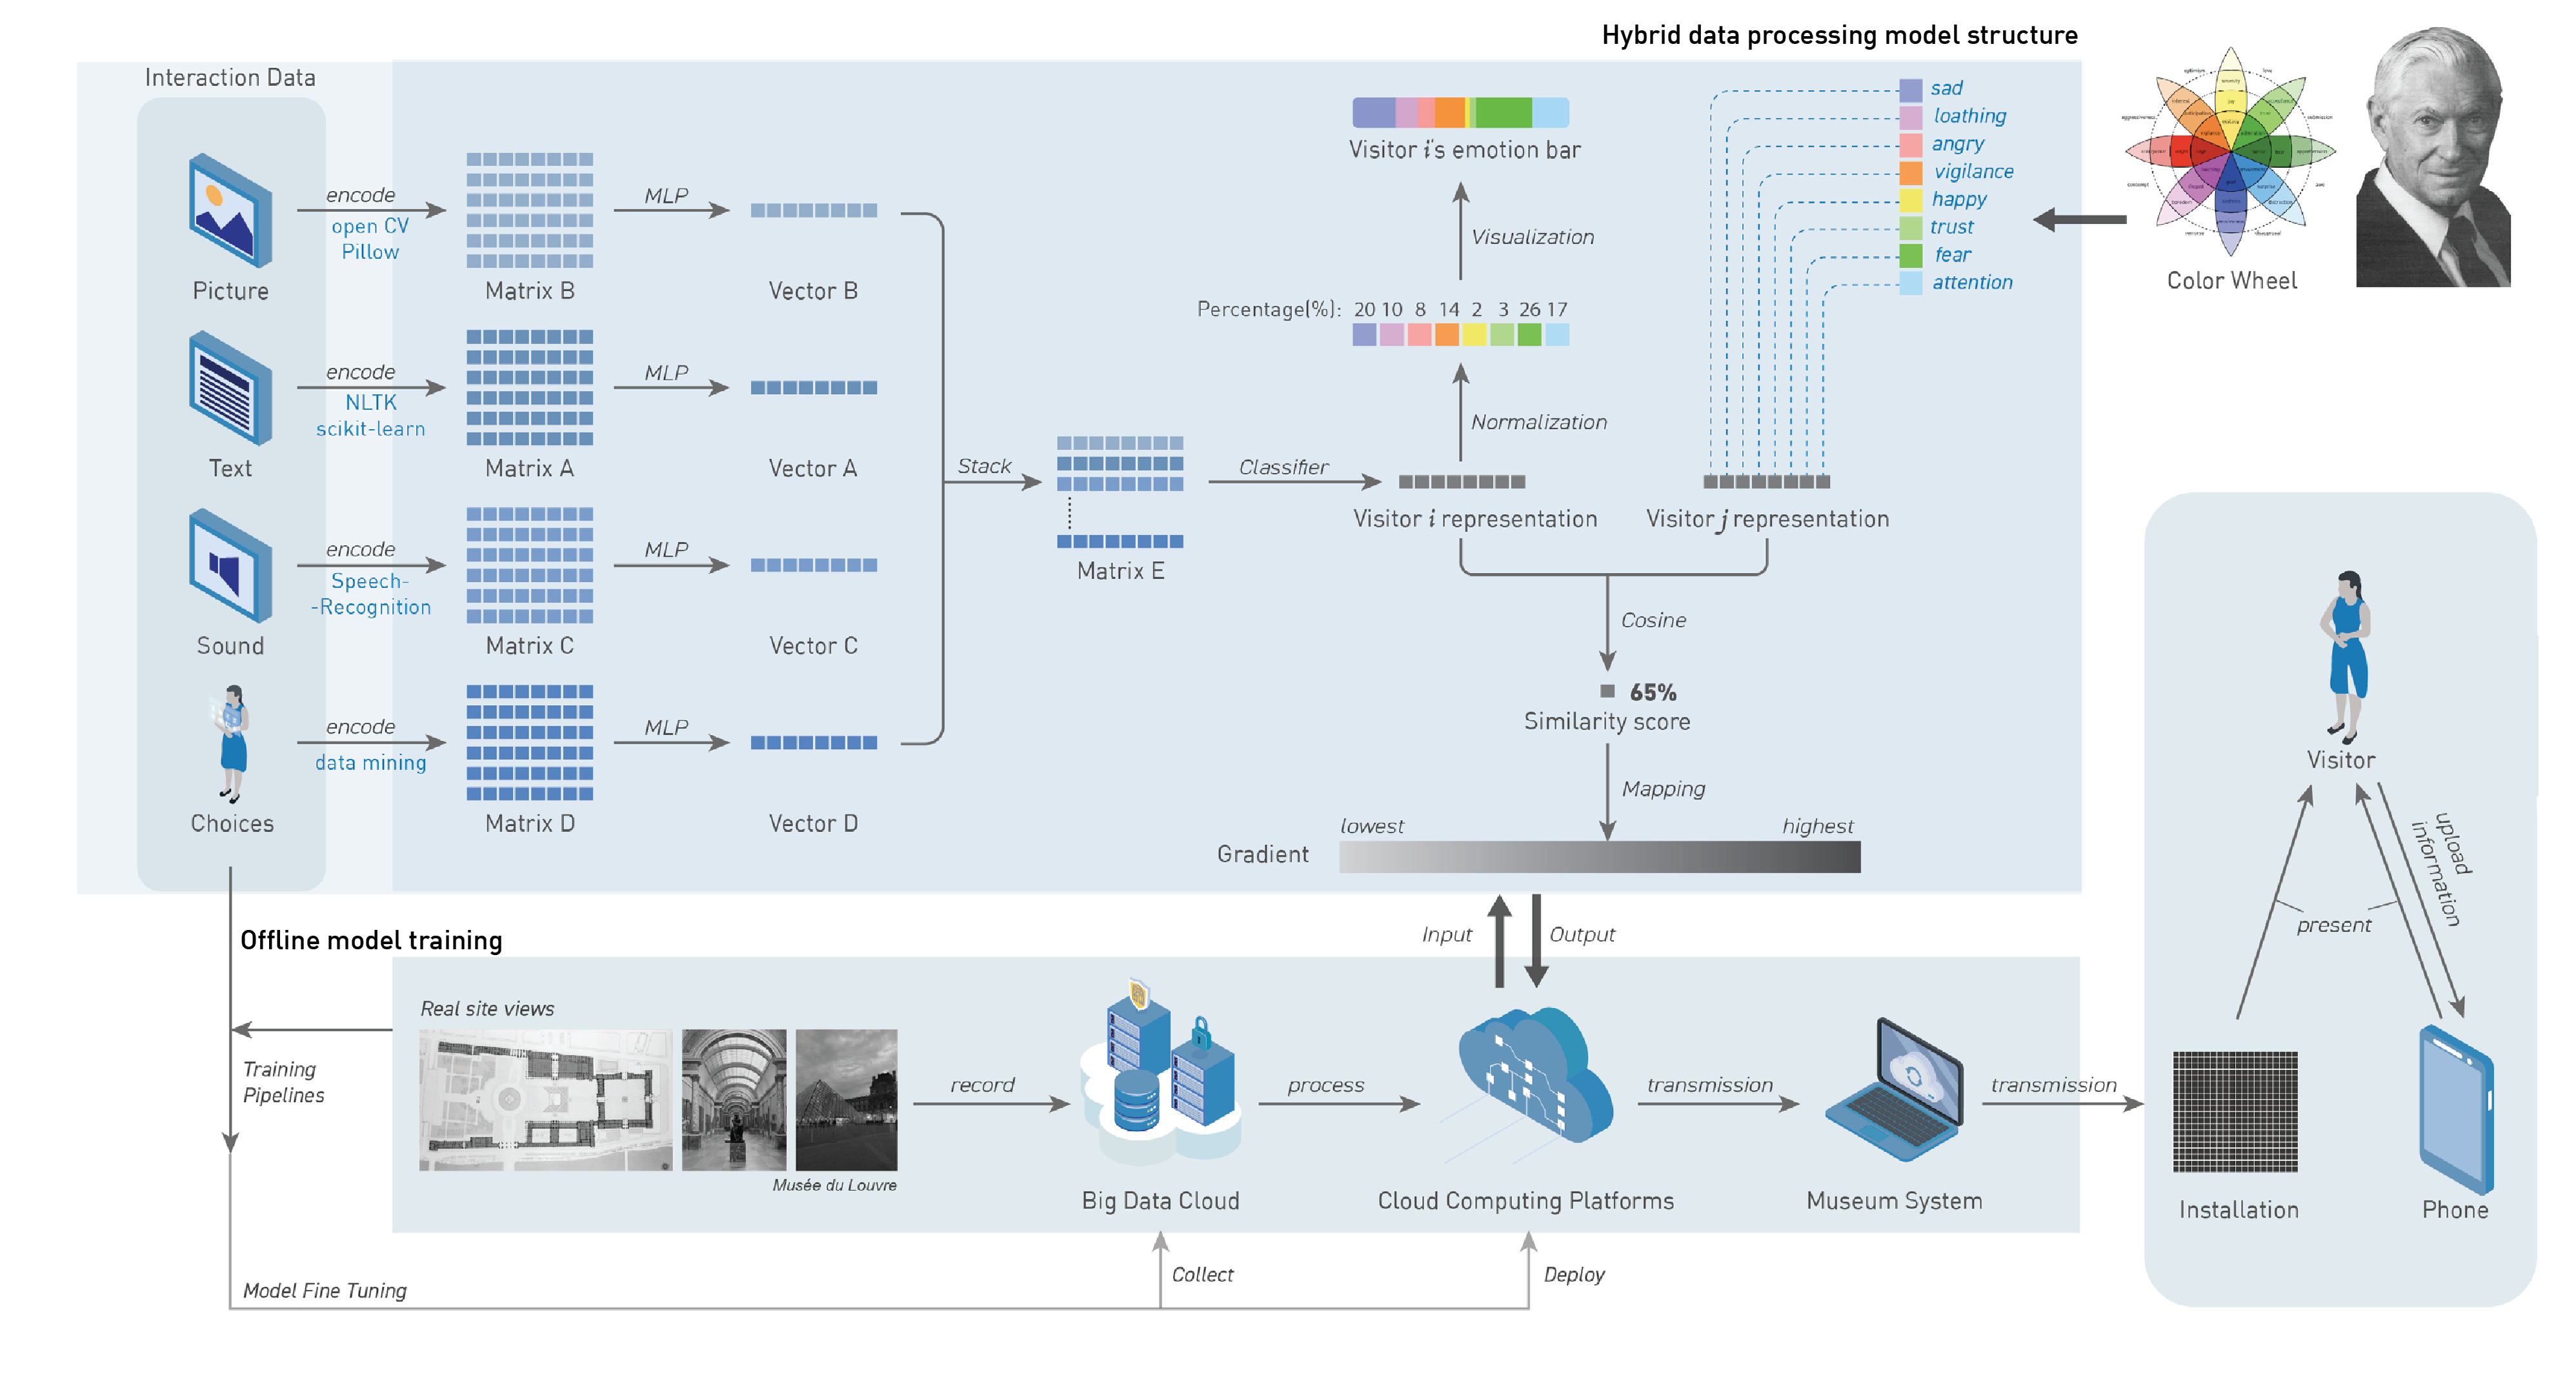
App Design

Experience Map
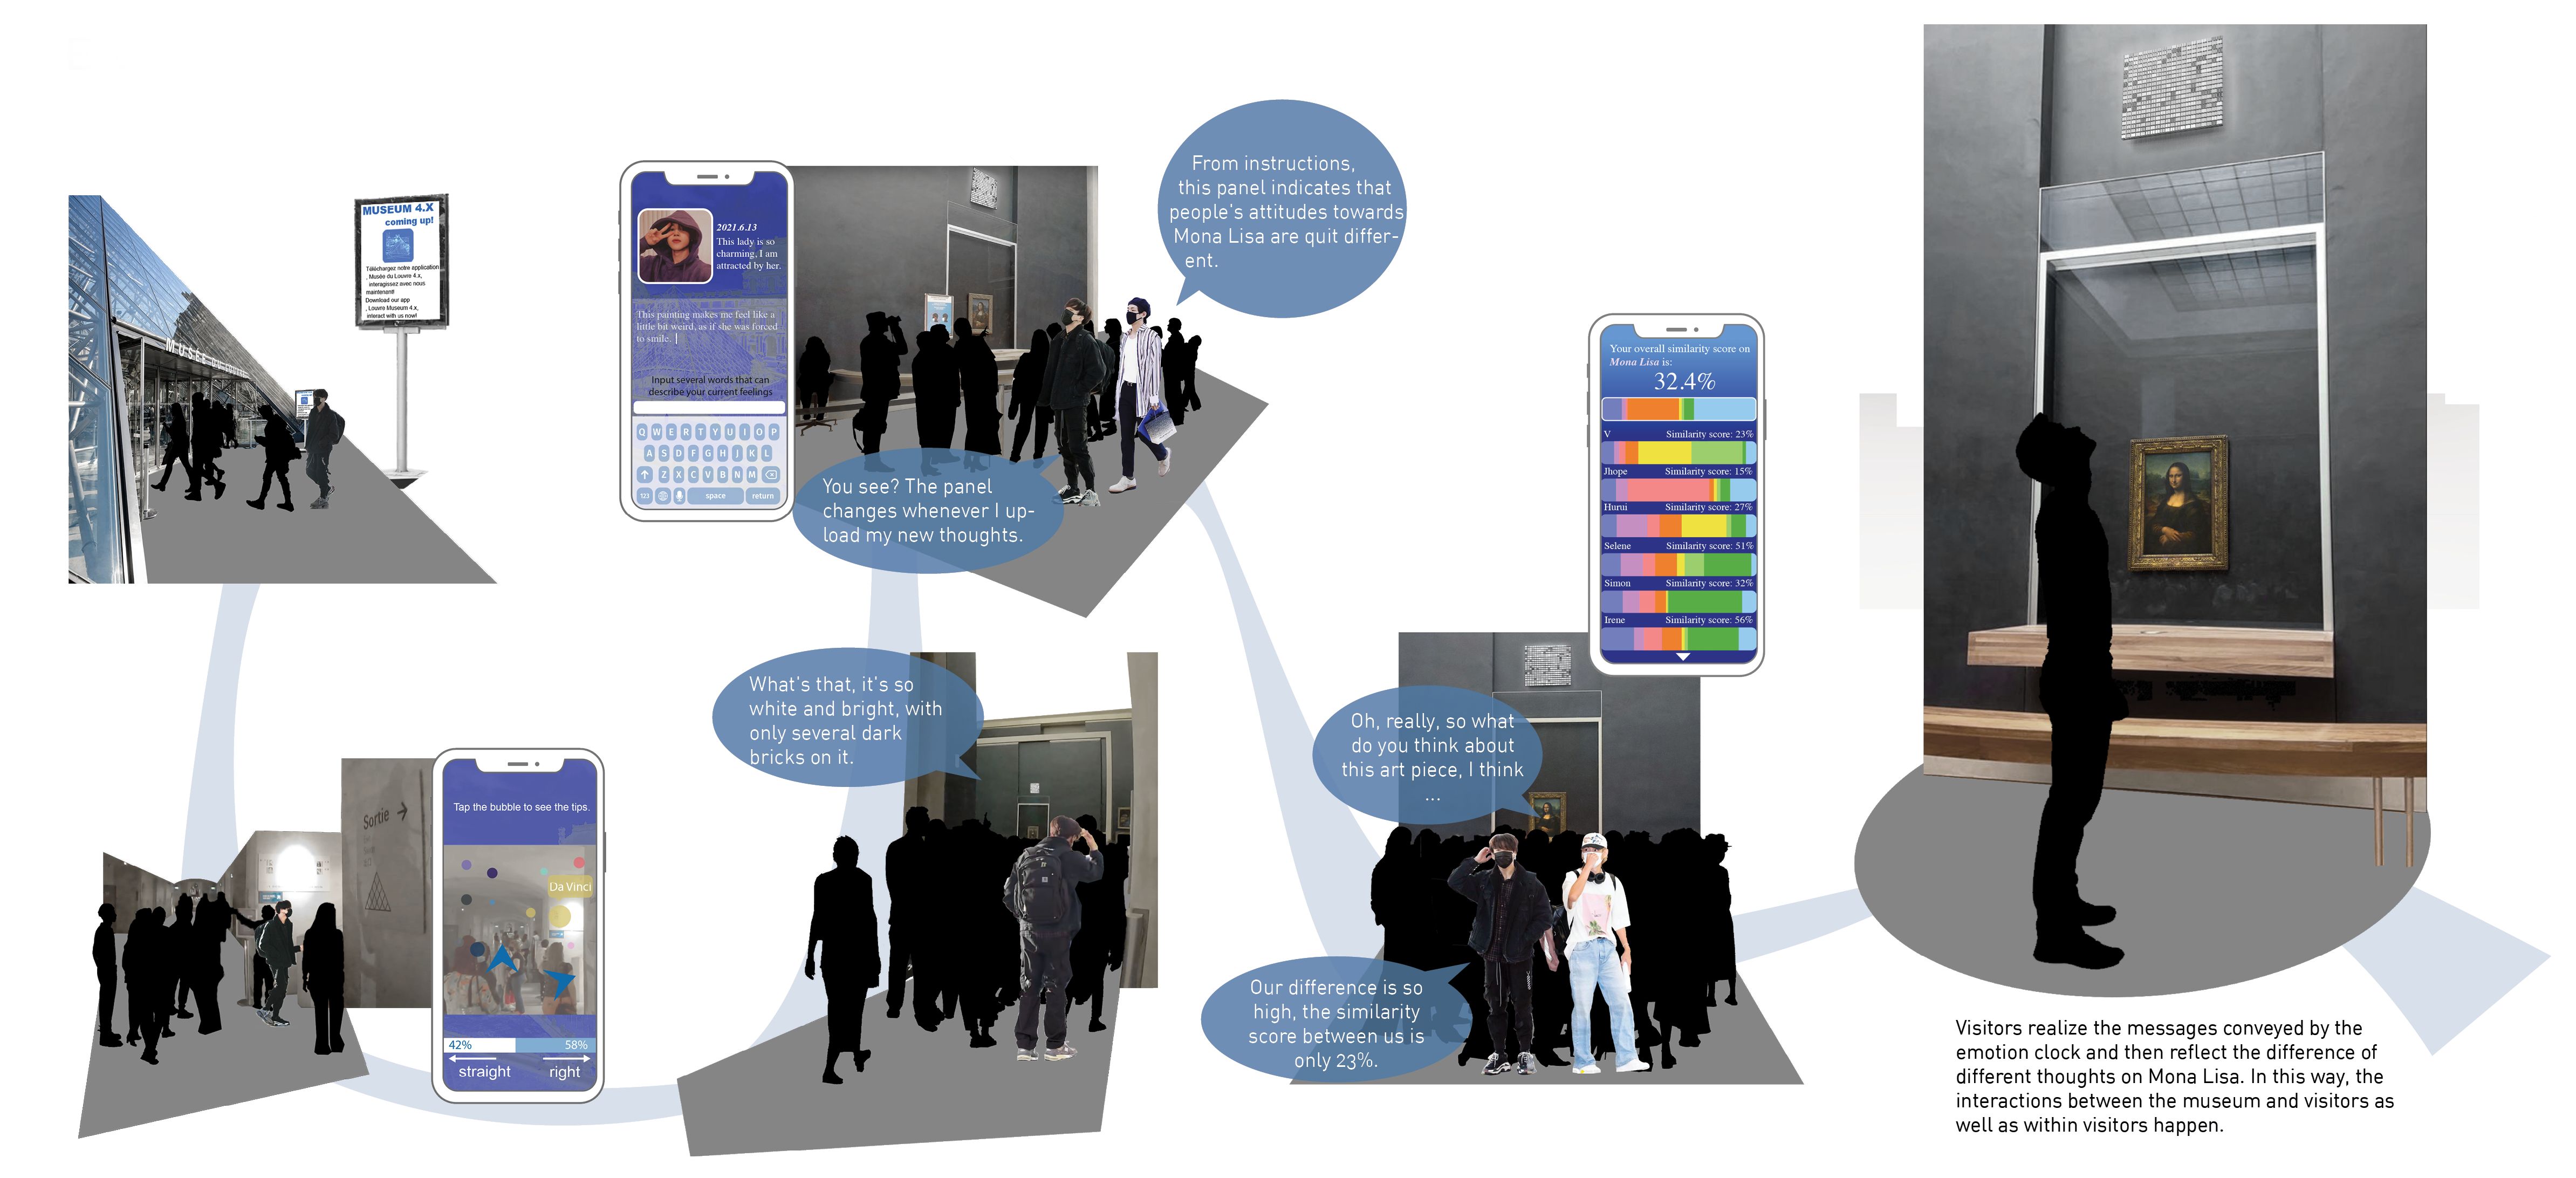
More Than Museums
The pattern proposed in this project above is not only suitable for different types of museums, such as art museums, history museums, science museums, etc., but also can be adapted to other places where knowledge sharing can take place, for instance, relics, building, school, or even the supermarkets.